What Is Technical Analysis?
Futures traders need to make the best-informed trading decisions they can, but with so many conflicting factors and influences in the market at any one time, it can be difficult to sort through all the noise. Technical analysis can provide a level of clarity to help guide trading decisions by systematically translating market factors and variables into a visualization on a trading chart in real time.
Technical analysis uses historical price and volume data to analyze and react to potential price movement. Most traders employ some level of technical analysis in their day-to-day futures trading regimen to determine market direction and select entry and exit points.

History of Technical Analysis
Believe it or not, technical analysis dates back to the 17th century and is the oldest form of market analysis. Munehisa Homma, a trader at the Osaka Rice Exchange, initially created candlestick charts to help visually represent supply and demand dynamics to identify basic trends and price patterns for the rice marketplace.
Today, much of modern technical analysis owes its roots to Charles Dow of Dow Jones fame. The Dow Theory identifies key concepts regarding price movement, volume and trends that drive most of technical analysis development and implementation to this day.
Three Foundations of Technical Analysis in Futures Trading
History Tends to Repeat Itself Due to Human Behavior
If history has taught us anything, it’s that human behavior usually leads to repeated reactions to similar market environments. When faced with the same or similar sets of conditions and circumstances, market participants generally tend to react the same way. While this may not be true on an individual basis, as an aggregate group, reactions can often be anticipated and revisited across historical trading chart data in the form of identifiable patterns.
Prices Tend to Trend
The saying “the trend is your friend” is a simple way of understanding that trends are where futures traders hope to make a profitable trade. From a trader’s point of view, a trend needs to be identifiable and actionable—otherwise it isn’t very useful. Technical analysis has a variety of tools that help traders identify trends in the futures markets and potentially when a trend is exhausted.
The Traded Price of a Futures Contract is a Reliable Interpretation of Market Conditions
The efficient market hypothesis (EMH) states that the traded prices for futures contracts generally reflect all the information the market participants know about that market including economic reports, unexpected news, rumors, and empirical facts. Based on this concept, the market data—and therefore the technical indicators applied to that data—can be said to be a reasonably reliable interpretation from a mathematical or observable point of view.

Technical Analysis Made Easy
Build your futures trading foundation using technical analysis to identify trends, support and resistance, and key chart patterns.
Technical Analysis Indicators for Futures Trading
There are various analytical tools to choose from, so let’s review by the type of price and volume action you want to measure. Starting here will help you identify your preferred approach and select the right tools for the job.
Trend Analysis
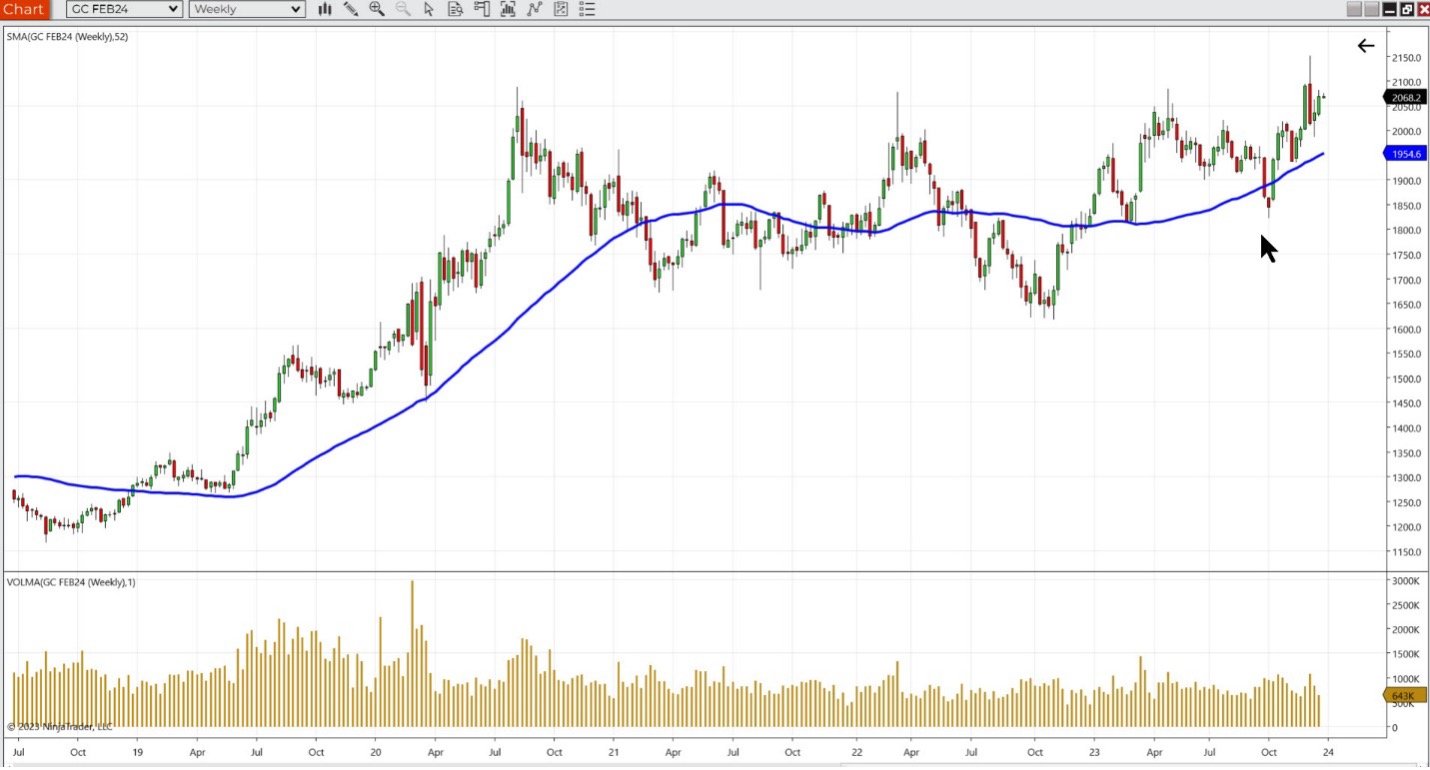
The most popular form of technical analysis is Trend analysis. Understanding the direction of a trend can help shape your bias for the trading day. The most common trend indicator is the simple moving average (SMA), which averages the closing price for many lookback bars.
Momentum
Momentum is the rate at which prices change over time. Momentum indicators attempt to quantify this rate of change to identify whether a market might be considered overbought or oversold. Relative strength index (RSI) and stochastics are the most common types of momentum indicators.
Volatility
Volatility is the tendency for price to change—that is, how much can we expect the price of a market to go up or down? Volatility studies like average true range (ATR) can be applied directly to a price chart at any timeframe, allowing for shorter- to longer-term analysis.
Volume
Volume can aid in understanding market sentiment or participation, which is helpful when determining whether a price move is “valid” (i.e., trend should continue in that direction) or not (i.e., a price move that reverts in the opposite direction).

Chart Market Data and Analyze Chart Patterns in Futures Trading
Charting market data is an easy way to begin analyzing the futures markets. It is a visual way to turn all the various market data points like price and volume into a simple and intuitive way to identify market direction, volatility, and key trading levels.
Futures traders analyze chart patterns both in real time and historically to help make more informed trading decisions, manage risk, and to gain a better understanding of market price behavior.

Learn how to trade futures with industry pros
Join our free livestreams as we prepare, analyze and target live futures trade setups in real time.
Watch our industry pros trade the futures market open every weekday at 9:15 am ET and the market close at 3:00pm ET using NinjaTrader’s award-winning charting and analysis tools.

Find Your Preferred Technical Analysis Approach
The study of technical analysis can be rewarding and have a profound impact on your futures trading and understanding of the markets. Learning how to interpret analytics can help you determine which technical analysis tools can best complement your trading style.
As you gain more knowledge and skill, technical analysis will allow you to build trading strategies that can be tested and optimized for maximum effect.
Simulated trading with live futures market data provides an ideal opportunity to test and explore various technical analysis tools. Get started with your free NinjaTrader account to practice risk-free and explore 100+ technical analysis indicators included with your platform.